Chi-square (χ2) test in Python (Pearson Chi-square test)
Chi-square (χ2) test for independence (Pearson Chi-square test)
- Chi-square test is a non-parametric (distribution-free) method used to compare the relationship between the two categorical (nominal) variables in a contingency table.
- For example, we have different treatments (treated and nontreated) and treatment outcomes (cured and noncured), here we could use the chi-square test for independence to check whether treatments are related to treatment outcomes.
- Chi-square test relies on approximation (gives approximate p value) and hence require larger sample size. The expected frequency count should not be < 5 for more than 20% of cells. If the sample size is small, the chi-square test is not accurate, and you should use Fisher’s exact test.
- Note: Chi-square test for independence is different than the chi-square goodness of fit test
Formula
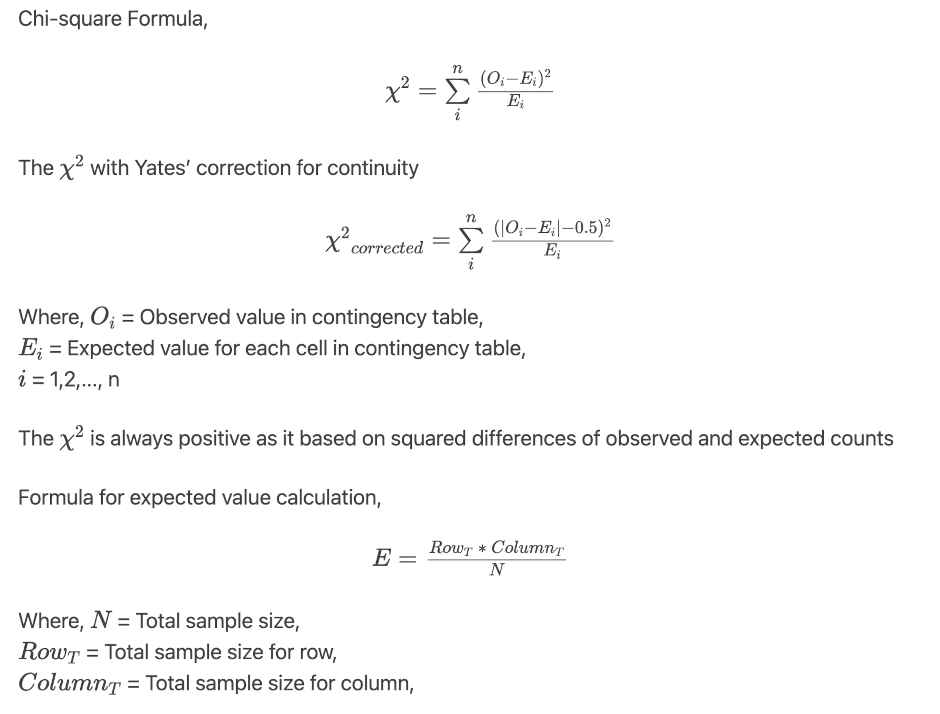
Hypotheses for Chi-square test for independence
- Null hypothesis: The two categorical variables are independent (no association between the two variables)
( H0: Oi = Ei )
- Alternative hypothesis: The two categorical variables are dependent (there is an association between the two variables) ( Ha: Oi ≠ Ei )
- Note: There are no one or two-tailed p value. Rejection region of the chi-square test is always on the right side of the distribution.
Learn more about hypothesis testing and interpretation
Chi-square test assumptions
- The two variables are categorical (nominal) and data is randomly sampled
- The levels of variables are mutually exclusive
- The expected frequency count for at least 80% of the cell in a contingency table is at least 5. Fisher’s exact test is appropriate for small frequency counts.
- The expected frequency count should not be less than 1
- Observations should be independent of each other
- Observation data should be frequency counts and not percentages, proportions or transformed data
Calculate a chi-square test for independence in Python
- We will use
bioinfokitv0.9.5 or later and scipy python packages - Check bioinfokit documentation for installation and documentation
- Download a hypothetical dataset for chi-square test for independence
Note: If you have your own dataset, you should import it as pandas dataframe. Learn how to import data using pandas
chi-square test for independence using bioinfokit,
from bioinfokit.analys import stat, get_data
# load example dataset
df = get_data('drugdata').data
df.head()
# output
   treatments  cured  noncured
0     treated     60        10
1  nontreated     30        25
# set treatments column as index
df = df.set_index('treatments')
# output
df.head()
            cured  noncured
treatments
treated        60        10
nontreated     30        25

# run chi-square test for independence
res = stat()
res.chisq(df=df)

# output
print(res.summary)
# corrected for the Yates’ continuity
Chi-squared test for independence

Test              Df    Chi-square      P-value
--------------  ----  ------------  -----------
Pearson            1       13.3365  0.000260291
Log-likelihood     1       13.4687  0.000242574

print(res.expected_df)

Expected frequency counts

      cured    noncured
--  -------  ----------
 0     50.4        19.6
 1     39.6        15.4
chi-square test for independence using chi2_contingency function from scipy package,
import numpy as np
from scipy.stats import chi2_contingency
# using Pearson’s chi-squared statistic
# corrected for the Yates’ continuity
observed = np.array([[60, 10], [30, 25]])
chi_val, p_val, dof, expected =  chi2_contingency(observed)
chi_val, p_val, dof, expected
# output
(13.3364898989899, 0.0002602911116400899, 1, array([[50.4, 19.6],
       [39.6, 15.4]]))

# without Yates’ correction for continuity
chi_val, p_val, dof, expected =  chi2_contingency(observed, correction=False)
chi_val, p_val, dof, expected
# output
(14.842300556586274, 0.00011688424010613195, 1, array([[50.4, 19.6],
       [39.6, 15.4]]))

# for log-likelihood method run command as below
chi_val, p_val, dof, expected =  chi2_contingency(observed, lambda_="log-likelihood")
Yates’ correction for continuity
- In the χ2 test, the discrete probabilities of observed counts can be approximated by the continuous chi-squared probability distribution. This can cause errors and needs to be corrected using continuity correction.
- Yates’ correction for continuity modifies the 2x2 contingency table and adjust the difference of observed and expected counts by subtracting the value of 0.5 (see formula).
- Yates’ correction for continuity increases the p value by reducing the χ2 value. The corrected p value is close to exact tests such as the Fisher exact test. Sometimes, Yates’ correction may give an overcorrected p value.
- χ2 and Yates’ corrected χ2 produce similar results on large samples, but Yates’ corrected χ2 can be conservative on smaller samples and gives a higher p value.
Interpretation
The p value obtained from chi-square test for independence is significant (p < 0.05), and therefore, we conclude that there is a significant association between treatments (treated and nontreated) with treatment outcome (cured and noncured)
Related reading
References
- Virtanen P, Gommers R, Oliphant TE, Haberland M, Reddy T, Cournapeau D, Burovski E, Peterson P, Weckesser W, Bright J, van der Walt SJ. SciPy 1.0: fundamental algorithms for scientific computing in Python. Nature methods. 2020 Mar;17(3):261-72.
- Bewick V, Cheek L, Ball J. Statistics review 8: Qualitative data–tests of association. Critical care. 2003 Feb 1;8(1):46.
- Serra N, Rea T, Di Carlo P, Sergi C. Continuity correction of Pearson’s chi-square test in 2x2 Contingency Tables: A mini-review on recent development. Epidemiology, Biostatistics and Public Health. 2019 Jun 21;16(2).
If you have any questions, comments or recommendations, please email me at reneshbe@gmail.com
This work is licensed under a Creative Commons Attribution 4.0 International License